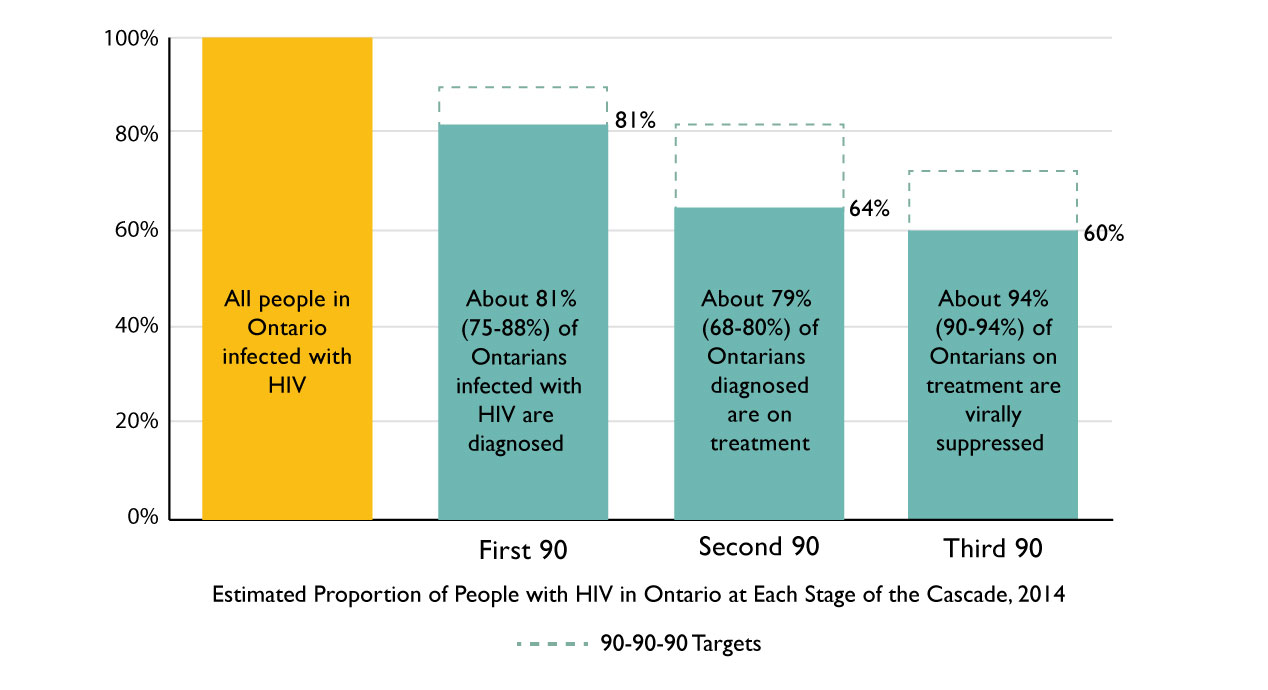
This bar graph demonstrates the gap between the 2014 HIV care cascade in Ontario and the 90-90-90 targets set by UN AIDS.
The first bar, which represents all people living with HIV in Ontario is set to 100% and serves as the baseline against which all other measurements are compared.
The second bar represents the proportion of all people living with HIV who have been diagnosed. Approximately 81% of all people living with HIV in Ontario have been diagnosed (confidence intervals are between 75% to 88%). This is 9% lower than the UN AIDS target to have 90% of people living with HIV diagnosed.
The third bar represents the proportion of people living with HIV who are on treatment. 64% of all people living with HIV in Ontario and 79% of all people living with HIV who have been diagnosed are on treatment (confidence intervals are between 68% and 80%). Because of the gap in diagnosis, the proportion of people on treatment is 17% lower than the UN AIDS target.
The fourth and final bar represents the proportion of people living with HIV who are virally suppressed. 60% of all people living with HIV in Ontario and 94% of all people on treatment are virally suppressed (confidence intervals are between 90% and 94%). Because of the gaps in diagnosis and treatment, the proportion of people who are virally suppressed is 12% lower than the UN AIDS target.